📊 التحليل الفني للذهب (XAU/USD)
18Jul
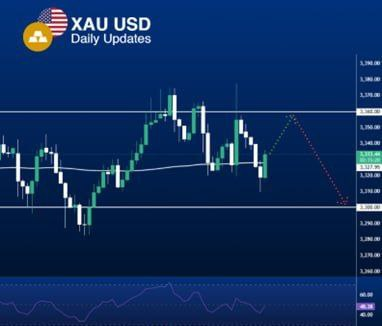
The daily gold (XAU/USD) chart is showing a bullish bounce after building on strong support near the 2,320 area, and is currently approaching strong technical resistance at the 2,370 level.
- Short-term trend: Neutral to bullish.
- The 50-day moving average supports the price and acts as a positive dynamic level.
- Bullish scenario: A break above 2,370 will open the way for an upward move towards 2,390 and 2,410.
- Bearish scenario: A failed breakout with a retest of 2,320 could lead to a decline towards 2,300 and possibly lower.
- The RSI indicator shows the beginning of positive momentum but without final confirmation.