📊 التحليل الفني لشارت النفط USOIL
18Jul
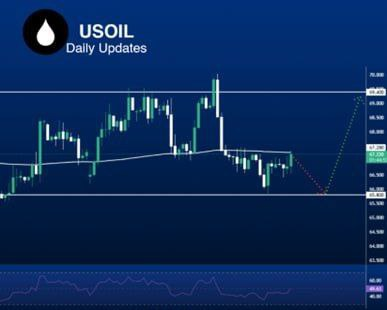
The daily chart of US Oil (USOIL) is showing a sideways movement between two strong support areas at 85.30 and a clear resistance at 89.30 .
- General trend: bearish sideways in the short term.
- The 50-period moving average is trending horizontally and tends to put downward pressure on prices.
- Possible positive scenario: A break above 86.90 will push the price towards retesting the key resistance at 89.30.
- Possible negative scenario: Breaking the support at 85.30 may trigger a bearish wave towards 83.50 and perhaps lower.
- The RSI indicator is showing weak momentum below the 50 level, reflecting indecision in the market.