MACD index explanation of MACD indicator and ways to use it with illustrations
15Jan
MACD indicator explanation MACD indicator
The MACD indicator is one of the main indicators in technical analysis and is mainly used by traders and technical analysts. It includes all the important strategies and modern systems of professional traders. There are a lot of strategies that mainly depend on the index, which is a strategy by itself and is indispensable to the chart for any professional trader.
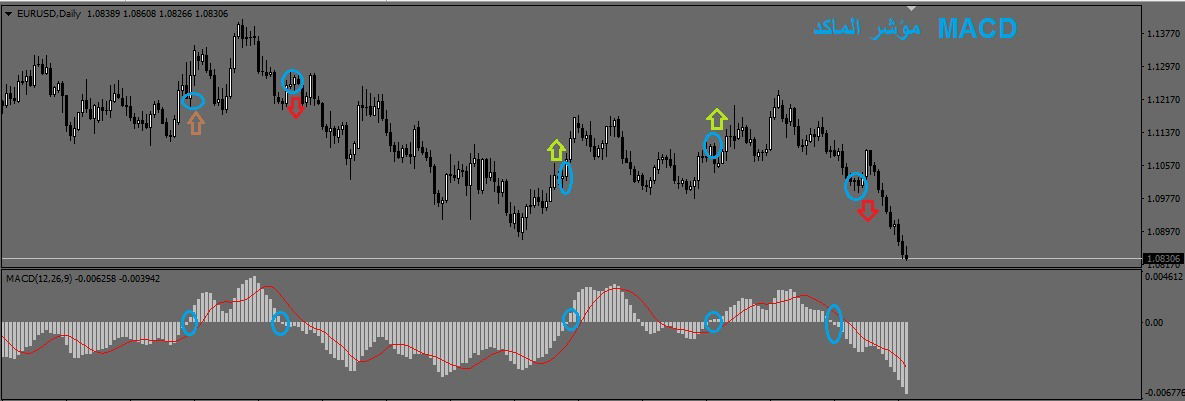
The first way to use the indicator?
It is possible to enter buying or selling at the intersection or falling of the indicator candles down or up from the level (zero) as shown in the picture above, as it is most likely that the price has changed direction for the opposite direction It can enter or it is better to break the resistance level or a minor support as a confirmation signal
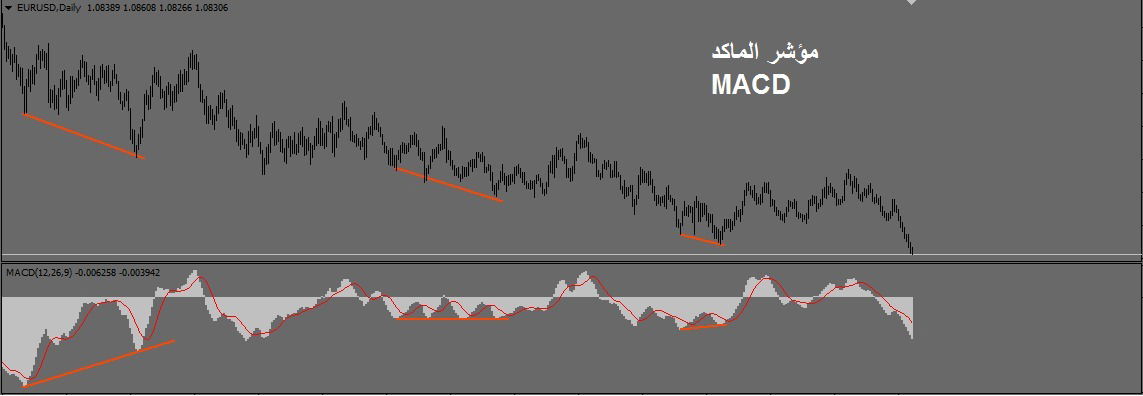
The second way to use the indicator?
The index can be accessed using the Divergence methods as shown in the picture above. This method is very effective with the indicator in default settings on all Frames and charts and is often used by professional traders in their trading mainly.
Entry based on divergence:
- The indicator is counter-price violating (upward price = downward indicator)
- Entering the market in the direction of the divergence or when the trend line is breached which represents resistance and this case is called (divergence fracture).
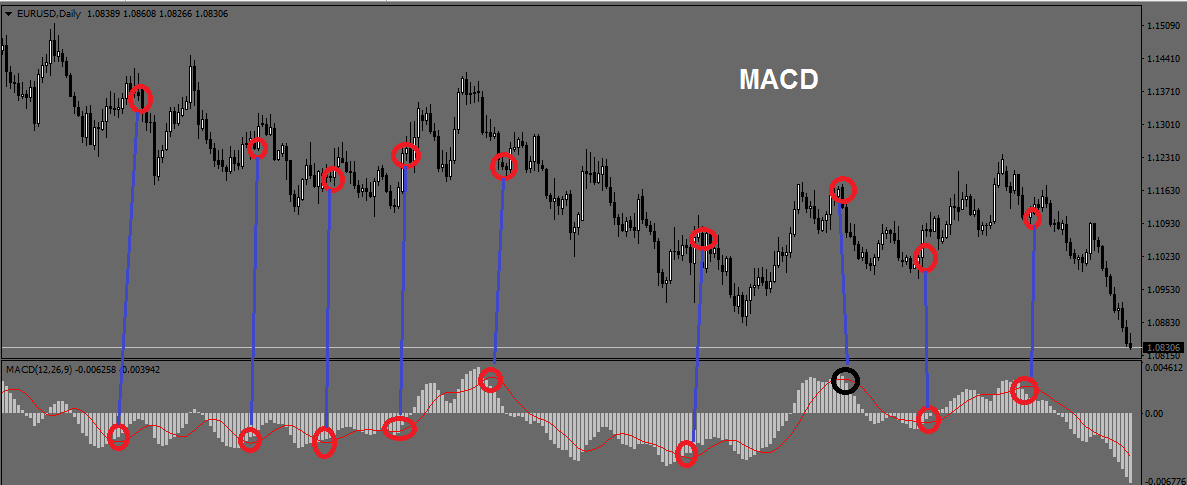
The third way to use the indicator?
- When the indicator candles break the red moving average line up or down as shown in the picture above, this method can be supported by drawing a classic trend as a general trend or breaking a resistance or a sub-support and then entering - in a simplified manner we are with MACD candles whenever the moving average breaks the market entry into the market
You can get the indicator from the MT4 platform with 12,26.9 default settings
مؤشر dsl macd شرح مؤشر macd histogram تحميل مؤشر macd مؤشر الماكد مؤشر الماكد المطور مؤشر ماكد مؤشر الماكد ذو الخطين مؤشر الماكد pdf مؤشر الماكد ابو خطين مؤشر ماكد ابو خطين مؤشر ماكد دايفرجنس مؤشر الماكد شرح المؤشر mfi-macd اسرار مؤشر الماكد أفضل إعدادات مؤشر الماكد اعدادات مؤشر الماكد شرح مؤشر الماكد وطرق الاستفادة منها rsi شرح مؤشر ستوكاستيك استراتيجية الماكد والموفينج مدرسة الفوركس مدرسة العملات مدرسة التداول مدرسة تعليم التداول مدرسة المتداول العربي مدرسة فوركس تعليم فورس تعلم فوركس تعلم سوق العملات Forex عملات trade