Explanation of the use of the RSI - RSI
15Jan
RSI - RSI
What is the RSI?
The Relative Strength Index, called RSI, is a technical indicator that analyzes financial markets and gives information about the momentum and in turn clarifies the strength or weakness of prices as it walks according to the closing prices for the last trading period.
The method of work ?
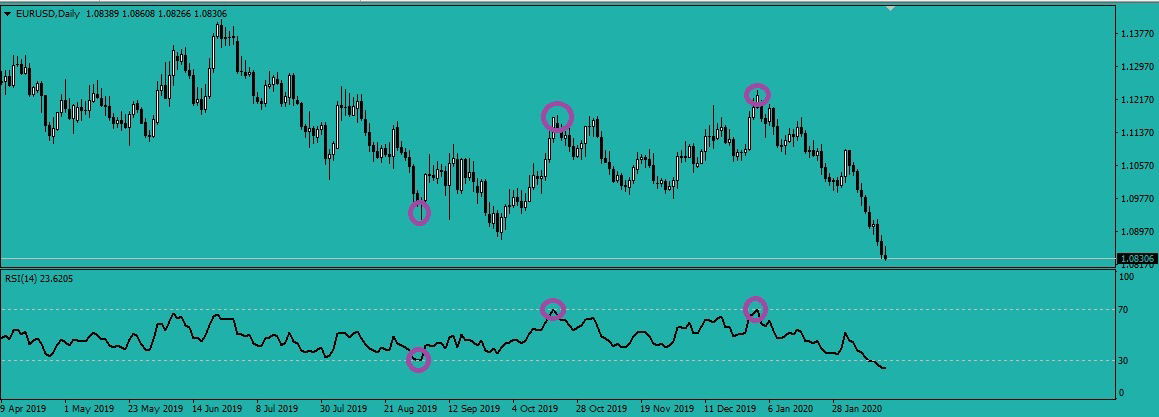
When the value of the RSI indicator on the chart reaches the default level of 70 and above, it is giving an overbought signal
When the RSI indicator on the chart reaches level 30 and below, it is giving oversold signal
As explained in the diagram above, the opportunities shown indicate the price reaching the momentum area and then the decline can be done in this way, but entry is when a support or a minor resistance level is broken. The results will be good and this use is common among traders.
It is possible to wait for entry to the peak area above 70 or less than 30 and then wait for the return and break the level on the index is less than 70 or above 30 then enter with the trend while maintaining the stop loss below the bottom or above the top
The second way to use the indicator?
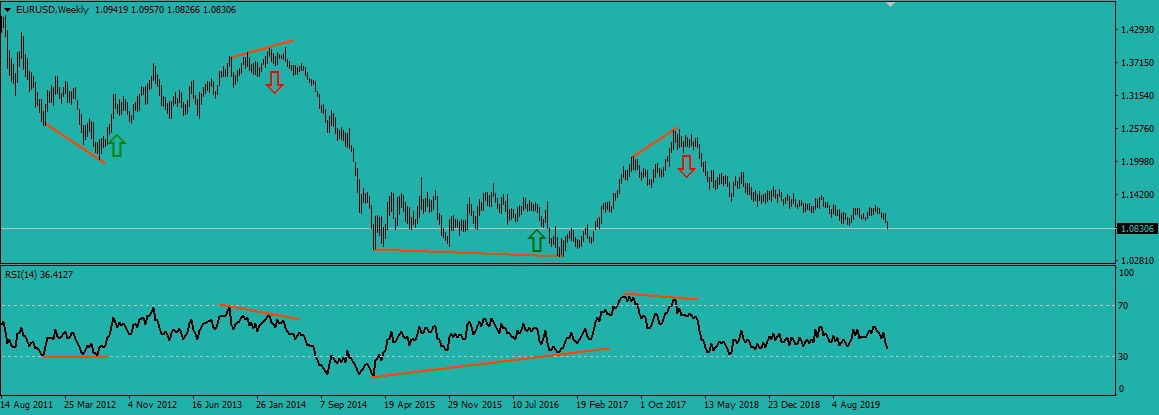
It is possible to work on the index in the divergence system as shown in the above picture. This method gives strong signals and it is a strategy on its own. It is possible to work on all charts and all types of divergence. You can view all types of divergence from the trading strategies section of the site.
It is also possible to work with the index in the classic way, which is to draw the trend on the indicator and enter with the trend, or wait for the trend to break on the indicator and then enter while maintaining the stop loss, such as the top or bottom of the bottom.
You can get the index with default settings 14 from the MT4 platform, and it is commonly used in 7, 14, or 21 settings
مؤشر rsi المطور مؤشر rsi شرح مؤشر rsi مع البولينجر مؤشر rsi مع تنبيه مؤشر rsi pdf مؤشر rsi للسوق السعودي اسرار مؤشر rsi معادلة مؤشر rsi مؤشر ال rsi شرح مؤشر rsi-bars افضل اعدادات مؤشر rsi حساب مؤشر القوة النسبية مؤشر rsi المطور استراتيجية مؤشر rsi تحميل مؤشر rsi مؤشر stochastic rsi intubation مؤشر rsi rsi indicator indicator forex forex trading systems مؤشر تداول بالمؤشرات مؤشرات فوركس اقوى المؤشرات مؤشر الزخم مؤشرات الزخم مؤشر القوة النسبية