Monthly technical analysis on the EURUSD chart for September (9) 2020
01Sep
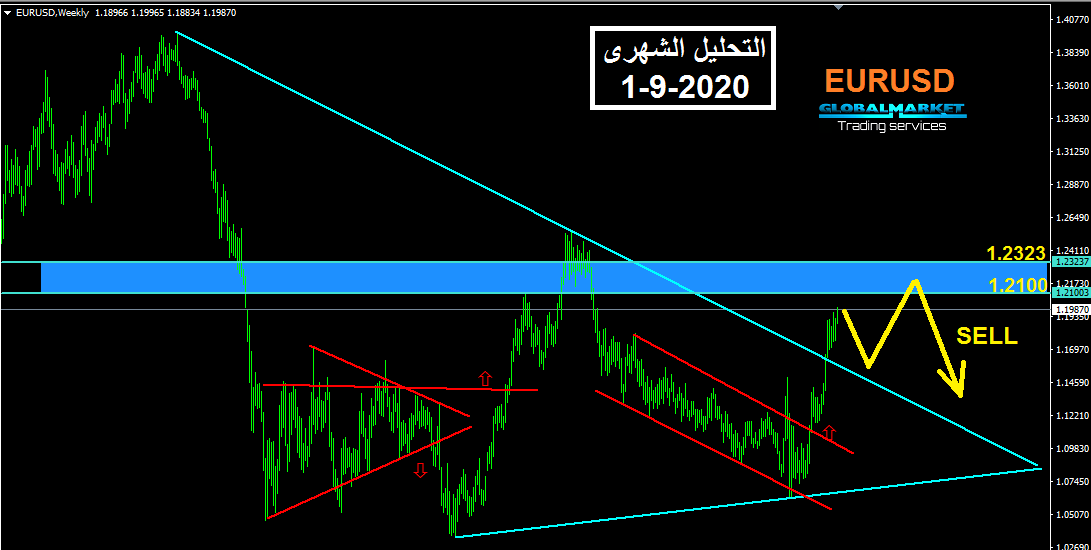 The Eurodollar on the weekly chart broke the downtrend for several weeks and is trading above it with a big positive. Trading in current prices is not recommended for medium and long term traders, but traders are advised according to the above chart. Buying from testing the downtrend with far-reaching swing deals while maintaining a suitable stop loss below the broken trend, as this trend is the pivot for the pair until the end of the year.
But in the event that the price rose with the same positivity, the next selling points will be the following resistances at levels 1.2103 - 1.2323, and the selling targets will also swing, while maintaining an appropriate stop loss above the level of 1.2323.
You can watch the analysis on the Telegram channel here
التحليل الفنى الشهرى التحليل الفنى شارت EURUSD EUR USD سبتمبر لشهر سبتمبر dailyfx اليورو دولار تحليل تداول اليورو مقابل الدولار eur usd تحليل free forex charts exchange rate for usd to gbp forex news today euro rate in forex live forex trading account forex market online forex market trading online forex trading best forex strategy investing افضل برنامج تداول برامج التداول بالعملات افضل برنامج تداول العملات استثمار العملات الرقمية شركة forex com اسهم العملات الرقمية سوق العملات الرقمية kuwait stock market تداول العملات الرقمية سوق العملات الرقميه best forex signals تداول العملات الالكترونية forex demo account معلومات عن العملات الرقمية ark ark داماك العقارية دبي بورصة اليورو مقابل الدولار الفرق بين الدولار واليورو تحويل العملة من اليورو للدولار اليورو كم دولار يساوي سعر اليورو بالنسبة للدولار اليورو مقابل الدولار مباشر معامل اليورو للدولار مقارنة اليورو بالدولار فرق العملة بين اليورو والدولار سعر اليورو بالدولار دولار الى يورو يورو دولار أمريكي فرق بين دولار ويورو سعر صرف الدولار لليورو سعر اليورو الى الدولار الدولار بالنسبة لليورو صرف اليورو مقابل الدولار فرق العملة بين الدولار واليورو دولار يورو تحويل تصريف يورو الى دولار اليورو كم يساوي دولار تصريف دولار يورو سعر صرف يورو دولار سعر اليورو اليوم بالدولار معامل تحويل اليورو للدولار صرف يورو دولار تحويل العملات من يورو الى دولار سعر اليورو والدولار اليوم تحويل من دولار الى يورو يورو على دولار سعر الدولار بالنسبة لليورو اليورو مباشر اسعار اليورو والدولار تحويل اليورو للدولار تحويل يورو دولار اسعار اليورو عالميا نسبة اليورو الى الدولار كم دولار يساوي اليورو تصريف من اليورو الى الدولار تحويل من يورو لدولار سعر اليورو للدولار سعر صرف يورو مقابل دولار اليورو يعادل كم دولار تحويل من يورو الى الدولار الفرق بين اليورو والدولار سعر الدولار يورو تصريف اليورو الى دولار سعر صرف الدولار بالنسبة لليورو صرف الدولار على اليورو سعر صرف اليورو دولار للتحويل من يورو الى دولار نسبة اليورو للدولار تحويل العملات من دولار الى يورو نسبة الدولار الى اليورو سعر الدولار الى اليورو يورو دولار امريكي اليورو والدولار سعر اليورو مع الدولار اسعار الدولار مقابل اليورو سعر اليورو عالميا كم يساوي يورو بالدولار سعر يورو بالدولار تحويل من يورو الي دولار اليورو كم يساوي بالدولار اسعار اليورو دولار سعر اليورو ع دولار فرق اليورو والدولار يورو بالدولار اسعار اليورو مقابل الدولار تصريف الدولار على اليورو اسعار الدولار يورو الدولار على اليورو اليورو والدولار اليوم سعر صرف الدولار الى اليورو تحويل من دولار ليورو اليورو اليوم تحويل اليورو الي دولار تحويل عملات يورو الى دولار تحويل يورو للدولار بورصة اليورو صرف اليورو على الدولار معامل تحويل اليورو الى دولار سعر صرف الدولار مع اليورو اليورو الدولار تحويل من اليورو الى الدولار سعر الدولار مع اليورو يورو دولار اون لاين اليورو تحليل دولار ويورو كيفية تحويل اليورو الى دولار كم دولار في اليورو سعر صرف اليورو بالدولار فرق دولار يورو سعر اليورو تحويل دولار الى يورو بورصة يورو يورو على الدولار سعر الدولار لليورو تحويل دولار لليورو اسعار اليورو على الدولار الدولار اليورو كم يورو يساوي الدولار سعر الدولار يورو اليوم سعر يورو على دولار تحويل من دولار الي يورو سعر صرف اليورو للدولار اليورو على الدولار صرف اليورو بالدولار الدولار باليورو تصريف اليورو بالدولار الدولار واليورو زوج اليورو دولار سعر صرف الدولار مقابل يورو تحويل من اليورو للدولار دولار لليورو الدولار كم يورو يورو عل دولار شاشة الدولار مقابل اليورو اليورو بكام دولار سعر اليورو مقابل الدولار نسبة الدولار لليورو سعر تحويل اليورو الى دولار سعر صرف اليورو الى الدولار سعر الدولار على اليورو بورصه اليورو دولار كم يساوي اليورو دولار سعر الدولار على يورو يورو دولار مباشر الدولار مقابل يورو سعر صرف اليورو اليوم تحويل اليورو مقابل الدولار كم يساوي اليورو بالدولار تحويل اليورو للدولار اليوم تحويل اليورو دولار سعر اليورو على الدولار سعر اليورو دولار الان صرف اليورو دولار تحويل من يورو الى دولار اليوم سعر دولار يورو صرف يورو مقابل دولار تحويل من دولار لليورو سعر صرف دولار مقابل يورو تحويل من اليورو الى الدولار الامريكي اليورو يساوي كم دولار تحويل من الدولار لليورو الدولار الى اليورو كم اليورو بالدولار سعر صرف الدولار باليورو سعر اليورو دولار مباشر يورو دولار اليوم كم سعر اليورو بالدولار العلاقة بين الدولار واليورو تحويل الدولار ليورو سعر صرف اليورو على الدولار تحويل من دولار الى اليورو سعر يورو مقابل دولار اليوم اسعار اليورو والدولار اليوم تحويل من اليورو للدولار الامريكي تصريف اليورو للدولار صرف دولار يورو يورو الى دولار امريكي اليورو عل دولار تحويل يورو الي دولار يورو الي دولار يورو كم يساوي دولار تصريف اليورو على الدولار صرف اليورو مقابل دولار تحويل دولار يورو سعر الدولار اليورو اليوم كم يبلغ اليورو بالدولار اخبار اليورو دولار صرف يورو مقابل الدولار كم يعادل اليورو بالدولار يورو كم دولار تحويل عمله من الدولار الى اليورو مؤشر اليورو مقابل الدولار دولار على اليورو صرف اليورو عالدولار الدولار مقابل اليورو تحويل تحويل من دولار الى يورو اليوم سعر الدولار اليوم واليورو سعر اليورو للدولار اليوم صرف اليورو الى دولار اليورو ع دولار اسعار الدولار امام اليورو دولار كم يورو شاشه اليورو صرف اليورو محول البيتكوين يورو يساوي كم دولار تصريف اليورو مقابل دولار يورو مقابل دولار امريكي سعر يورو مقابل الدولار تحويل من الدولار الامريكي الى اليورو دولار يورو اليوم كم يعادل الدولار باليورو تحويل من اليورو الى دولار سعر صرف اليورو فرق الدولار عن اليورو اليورو كم بالدولار تحويل من الدولار الى يورو تحويل الدولار لليورو تحويل العملات دولار الى يورو واحد دولار كم يساوي يورو صرف الدولار مقابل يورو تحويل دولار الى يورو اليوم سعر اليورو اليوم على الدولار تصريف يورو دولار صرف الدولار باليورو تحويل العملة من اليورو الى الدولار مؤشر اليورو دولار سعر الدولار باليورو investing بالعربي سعر صرف الدولار على اليورو اسعار الدولار على اليورو يورو دولار الان تحويل العملات يورو دولار تصريف اليورو مقابل الدولار الدولار كم يساوي يورو واحد يورو كم يساوي دولار سعر صرف الدولار مقابل اليورو اليورو بالنسبة للدولار ماهو سعر اليورو مقابل الدولار دولار الى اليورو بورصه اليورو والدولار كم يساوي اليورو على الدولار سعر صرف اليورو مقابل دولار صرف الدولار امام اليورو اخبار يورو دولار من اليورو للدولار ريت اليورو فرق الدولار على اليورو تحليل يورو دولار اليورو مقابل الدولار تحويل كم الفرق بين الدولار واليورو 1يورو كم دولار صرف يورو على دولار اليورو مقابل الدولار الأمريكي سعر يورو مقابل الدولار اليوم الفرق بين اليورو والدولار اليوم تحويل الدولار على اليورو يورو الى الدولار كم يساوي اليورو بالنسبة للدولار يورو دولار سعر صرف يورو مقابل دولار اليوم تحليل اليورو دولار اليوم يورو مقابل دولار اليوم سعر اليورو امام الدولار تحويل من الدولار الى اليورو اسعار يورو مقابل دولار اسعار العملات يورو مقابل الدولار سعر دولار على يورو شارت اليورو مقابل الدولار سعر تحويل الدولار الى يورو صرف دولار مقابل اليورو سعر اليورو اليوم سعر اليورو على الدولار اليوم يورو مقابل الدولار اليوم فرق الدولار واليورو سعر اليورو دولار اليوم سعر الدولار مقابل يورو تحويل العملات من الدولار الى يورو تحويل من يورو للدولار الدولار الى يورو كل يورو كم دولار من الدولار لليورو اليورو مقابل دولار اسعار دولار مقابل يورو الدولار اليورو اليوم سعر صرف اليورو مقابل الدولار يورو مقابل الدولار الامريكي صرف دولار مقابل يورو سعر الدولار الى اليورو اليوم توقعات اليورو دولار توقعات يورو دولار كم قيمة اليورو بالدولار فرق اليورو على الدولار تحليل دولار يورو دولار مقابل اليورو اليوم دولار الي يورو تحويل يورو الى دولار اليوم يورو الى دولار اليوم سعر تحويل الدولار لليورو كم يساوي الدولار باليورو تحويل اليورو الى دولار اليوم شاشة اليورو مقابل الدولار اليوم دولار امريكي مقابل يورو سعر يورو مقابل دولار دولار مقابل يورو اليوم سعر الدولار امام اليورو من اليورو الى الدولار بورصة عملات رقمية