📊 التحليل الفني للبيتكوين (BTC/USD)
18Jul
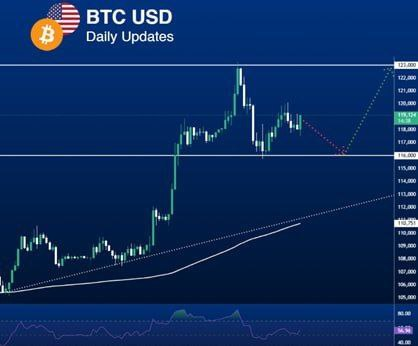
The Bitcoin against the US Dollar (BTC/USD) chart shows continued consolidation above the major support at 117,000 , after a downward correction from the high at 122,000 .
- General trend: Upward in the medium term.
- Bullish scenario: In case of a rebound from the current support and a break of 119,500 , we may witness an upward movement towards 122,000 and then 125,000 .
- Bearish scenario: A break of the support at 117,000 could lead to a retest of the moving average and the ascending trend line near the 113,000 - 110,000 levels.
- The RSI is trending upward from the oversold zone, supporting the possibility of a bullish reversal.
Comments